Ampian AI vs Doing It Yourself: What the Free Tools Give a Home Buyer, and What We Offer
Free data from FEMA, First Street, the county assessor and Zillow each answer different homebuying questions. This comparison explains when the free tools are enough and how Ampian AI adds value by bringing the findings together in organized reports that help homebuyers make informed decisions.

Written by Toan Vo ·
This article was drafted with AI help, reviewed, and approved by Toan Vo.
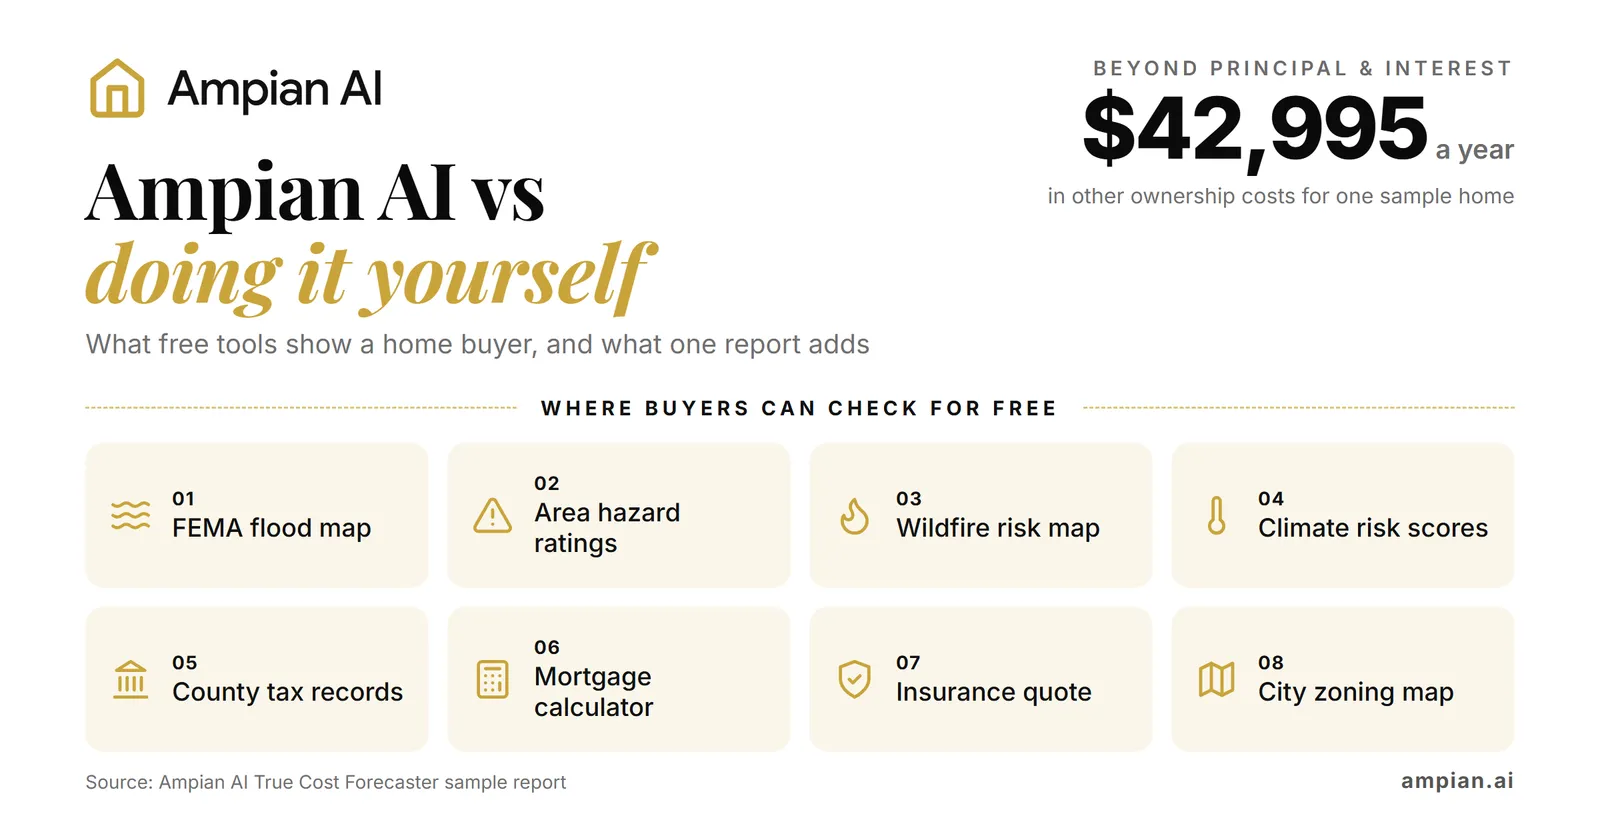
You can research many of the same details yourself through FEMA, the U.S. Forest Service, your county assessor and a mortgage calculator. The work is in interpreting the findings and forecasting the hidden costs. For example, our Ampian AI True Cost Forecaster sample report estimates $139,403 a year1 across ten expense categories for one early-1900s house. Mortgage principal and interest accounts for $96,4081 of that.
Much of the information Ampian AI uses is publicly available, and our About Our Data page explains the sources behind our reports. The choice is whether you are willing to gather, interpret and compare the information for each home yourself or let Ampian AI handle that work. Below, we explain when DIY research may be enough and when Ampian AI can help.
Key takeaways
- FEMA’s Flood Map Service Center provides official flood-zone information. Ampian AI uses the same FEMA data, so if you only need to look up a home’s mapped flood zone, you can check FEMA directly.
- Flooding can happen outside high-risk zones. From 2014 to 2024, FEMA reports that 29%4 of federal flood insurance claims came from outside areas currently classified as high risk.
- Area hazard ratings do not assess an individual home. FEMA’s National Risk Index covers 18 natural hazards5 and provides community-level ratings through its planning tool, RAPT.
- Zillow changed how it displays climate risk. In November 2025, it removed climate risk scores from more than 1 million listings7 and linked to First Street instead.
- The seller’s tax bill may differ from yours. Local tax records show the existing assessment and bill, but a purchase can trigger reassessment in some states. Ask the assessor how the sale could affect your taxes.
- Your housing budget extends beyond the loan payment. In Ampian AI’s True Cost sample, other expenses and repair savings add $42,995 a year16 beyond mortgage principal and interest.
- DIY research works if you have the time and knowledge to check the information. Free tools can support your research alongside the seller’s bills, insurance quotes and a paid inspection. Ampian AI organizes the findings, and its True Cost Forecaster gives estimates you can compare across homes.
Can I get the information for free?
Much of it, yes. FEMA flood maps, local property records and many city zoning maps are publicly available. Our report is built from those kinds of sources plus a few licensed ones named on our About Our Data page.
“Free” still has a cost, though. Each tool answers one question, in its own format, for its own kind of area. A flood map gives you a zone letter. A hazard index gives you a rating for a census tract. An assessor gives you last year’s bill for the seller. None of them tells you what owning this house will cost your household each month, and none of them talks to the others. The work is in opening each one, reading it correctly, and calling local utility providers to estimate expenses for every house you are serious about.
Ampian AI handles the manual work of gathering information from its listed sources and turns it into clear explanations and organized estimates. It names its sources, and our About Our Data page shows the data date for most of them, so you can see where the information comes from and how current it is. Ampian AI’s True Cost Forecaster estimates ownership expenses, while its Zoning Oracle explains zoning rules, natural hazards and neighborhood details. Together, these reports help you compare homes without assembling the research yourself. You’ll still need inspections, insurance quotes and official confirmation of rules for the property. If you prefer to do the research yourself, the steps below explain how.
What each free tool gives you
FEMA’s Flood Map Service Center: the official flood zone
FEMA describes its Flood Map Service Center as “the official public source for flood hazard information produced in support of the National Flood Insurance Program.” You can enter an address, a place, or map coordinates and see the flood map for that spot.
FEMA’s flood maps use letters to identify risk levels. High-risk flood areas begin with the letters A or V, and moderate- to lower-risk areas are marked B, C or X, according to FEMA FloodSmart. Homes in high-risk zones with government-backed mortgages require flood insurance. Some lenders also require coverage outside these zones18.
What the map does not tell you: A flood zone identifies an area’s mapped risk; it does not predict whether a particular house will flood. FEMA updates its maps over time, so check the latest version. Nearly one-third (29%4) of flood insurance claims from 2014 to 2024 came from outside the high-risk areas. Our flood zone guide walks through the lookup step by step.
FEMA’s National Risk Index: the area’s other hazards
The National Risk Index rates an area’s exposure to 18 natural hazards5, such as earthquakes, tornadoes, strong wind, heat waves and hail. FEMA’s latest update, v1.205, is now available in its Resilience Analysis and Planning Tool (RAPT), and the old National Risk Index map address now forwards there.
What it does not tell you: These ratings compare risk across census tracts—small geographic areas used for statistics—and do not assess an individual home2. FEMA’s RAPT tool is designed to support community planning, so interpreting its maps may take more effort than a simple address search.
First Street: a property-level flood and fire model
First Street provides climate risk scores for individual properties. The scores “estimate a structure’s exposure to a hazard — not potential damage — over a cumulative 30-year8 period,” according to Insurance Journal. Zillow showed these scores on its listings until it removed them from more than 1 million listings7, with the change taking effect Nov. 14, 20258. Zillow replaced them with links to First Street, TechCrunch reported. At the time, TechCrunch also reported that the scores remained on Realtor.com, Redfin and Homes.com.
What it does not tell you: A risk score reflects a model’s assumptions and data. One comparison of First Street’s flood model with a University of California, Irvine model found they matched just 21%8 of the time. Therefore, we read a score as a reason to look closer, not as an answer. First Street’s basic residential reports provide free risk scores and an overview of risk over time. More detailed information and features require a paid report. Our guide to flood and wildfire risk after Zillow’s climate scores covers where else to look.
Your county or city assessor: the current tax bill
Your local assessor determines the property value used to calculate taxes. Check the year shown in online records. In Boston, for example, you “can search FY 2026 real estate assessments and taxes online” through the city’s Property Lookup tool, while the city is already in Fiscal Year 20279. So the number you see online can be a year behind.
What the records do not tell you: The current owner’s tax bill may differ from yours after purchase. Some states reassess a property when ownership changes. California’s Proposition 13, for example, “requires the county assessor to reassess the property to its current fair market value as of the date ownership changed,” according to the California State Board of Equalization. Our property tax after you buy guide covers how other states handle it.
Zillow’s mortgage calculator: the loan payment
Zillow’s mortgage calculator estimates your monthly payment using the home price, down payment, ZIP code, loan type and interest rate. It can also include property taxes, homeowners insurance, homeowners association fees and mortgage insurance.
What the calculator does not tell you: Its estimate depends on the information entered and any default assumptions. Your full housing budget also includes heating, water, yard care, snow removal and repairs. Taxes and insurance may already be included in your mortgage payment through an escrow account, which your lender uses to pay those bills, as the Consumer Financial Protection Bureau explains. Check what is included so you count each expense once. Our guide to hidden costs of owning a home explains why loan approval alone does not establish affordability.
The rest: wildfire, insurance, utilities and zoning
- Wildfire: The Forest Service’s Wildfire Risk to Communities offers free maps and resources to help you understand wildfire risk in the surrounding area. It does not assess the specific conditions of an individual home.
- Insurance: Request a quote from an insurer or independent agent. Have details ready, including the roof’s age, heating system and fuel, electrical panel, construction year and square footage. The seller’s premium may differ from yours because coverage and pricing depend on your circumstances, as our essay explains in the seller’s insurance premium isn’t your quote.
- Utilities: Ask the listing agent for the seller’s last 12 months of utility bills. They provide a useful record of past costs, though your bills may differ based on usage, household size and changing rates.
- Zoning: Some cities offer online zoning searches. San Francisco’s Find My Zoning, for example, lets you search by address or property identification number to view zoning maps and permitted uses. If no online tool is available, contact the local planning office. Our zoning guide covers towns without a tool like that.
Side by side: the free source and what one report adds
| What a buyer checks | Free source | What it gives you | What one Ampian AI report adds | Best pick |
|---|---|---|---|---|
| Official flood zone | FEMA Flood Map Service Center | The official flood map and zone for the address | The same FEMA flood layer, read for the parcel and shown beside the other hazards (“Flood: Minimal” in our Zoning Oracle sample) | Free tool |
| Other natural hazards | FEMA National Risk Index, in RAPT | Ratings for 18 natural hazards for the area | Earthquake, tornado, strong wind, heat wave and hail ratings for the address’s census tract, explained in plain words | Use both |
| Wildfire | Wildfire Risk to Communities | Community-level wildfire maps | The Forest Service’s wildfire hazard class for the area, in the same report | Use both |
| Flood and fire over 30 years | First Street | One model’s exposure score for the building | Nothing comparable. We do not run a 30-year property model, and our wildfire and hazard ratings describe the surrounding area | Free tool |
| Property tax | Your county or city assessor | The current owner’s assessed value and tax | A low-to-high tax range for a new owner, using the purchase price as the home’s value and any homestead exemption ($9,3841 to $14,2921 a year in our True Cost sample) | Use both |
| Monthly loan payment | Zillow’s mortgage calculator | A payment from the numbers you type in | Principal and interest as one of ten cost lines, added into one yearly figure | Free tool |
| Insurance | An insurer or independent agent | A real quote, once you ask | An estimate range before you call ($2,6161 to $4,3441 a year in our True Cost sample), with the home features that push it up or down | Use both |
| Heating and utilities | The seller’s last 12 months of bills | The house’s real past bills | Estimate ranges for electricity, natural gas, water and sewer, and heating oil, for when the seller has no bills to share | Free tool |
| Repairs | The inspection, equipment labels, city permit records | The condition and age of the big systems | A yearly repair reserve range for major replacements ($11,0671 to $17,6161 a year in our True Cost sample), based on the ages you enter | Use both |
| Zoning | Your city’s zoning map or planning office | The zone and its rules | The zone code, what it allows in plain English, and yes/no answers for extra units and short-term rentals | Use both |
| Nearby building plans | City planning agendas and local news | Official project records | Recent development news, with links to each story (five in our Zoning Oracle sample). These are news reports, not official city records | Free tool |
How to Research a Home Yourself: A Step-by-Step Guide
We haven’t found a reliable estimate of how long this research takes. The steps below outline the work involved:
- Flood zone. Enter the address on FEMA’s Flood Map Service Center and note the zone letter.
- Other hazards. Open FEMA’s RAPT, find the National Risk Index data for the address’s area, and note the ratings that matter where you are buying.
- Wildfire. Look up the community on Wildfire Risk to Communities.
- A second flood and fire view. Follow the First Street link on the listing, if there is one, and read the score as one model’s view.
- Property tax. Look up the assessed value and tax with the county or city assessor. Then call or email the assessor’s office and ask how the tax could change after a sale at your price.
- Loan payment. Run your price, down payment and rate through a mortgage calculator, using your own tax estimate from step 5, not the listing’s.
- Insurance. Get a homeowners insurance quote, and a flood insurance quote even outside a high-risk zone.
- Utilities. Ask the listing agent for the seller’s last 12 months of utility and fuel bills.
- Repairs. Note the age of the roof, furnace or boiler, water heater, appliances, and check the city’s permit records for past replacements.
- Zoning and nearby plans. Look up the zoning for the house and nearby lots, and scan the city’s recent planning agendas.
- Add it up. Put every yearly cost on one sheet, divide by twelve, and compare that number across the homes on your list.
Follow these steps for each home you’re seriously considering. Start with steps 5, 7 and 8, since you’ll need to allow time for others to respond.
Where the free tools are enough
Doing your own research may be enough in these situations:
- You only need the flood zone. If the question is “will my lender require flood insurance?”, FEMA’s map is the official answer. Our report reads the same FEMA layer.
- You are down to one house and have the time. Following the eleven steps above can help you understand the home’s costs, condition and potential risks.
- The seller hands you real bills. Twelve months of actual utility and fuel bills are better than any estimate, ours included.
- You already have quotes. An insurance quote and guidance from your local assessor give you more specific figures for your budget than our estimates. Our About Our Data page explains how these estimates differ from official tax amounts and insurer quotes.
- You want a property-level climate model. First Street’s scores are built for the individual building. Our wildfire and hazard ratings describe the surrounding area, not the exact home.
If these situations apply to you, free tools may meet your research needs.
What Ampian AI’s report does not do
An Ampian AI report does not replace the following:
- A home inspection. We do not inspect the home. Our analysis relies on the details you provide about its size, age and major systems.
- A bill or a quote. Our cost figures are low-to-high estimates, not a tax bill or an insurance price.
- A title search or insurance claims history report. You’ll need to obtain these separately to review the property’s ownership records and past insurance claims. Our guide to whether there is a Carfax for houses covers where a home’s past is recorded.
- An official record of nearby building plans. Our development items are news stories found by AI in reputable press. We do not track building permits or official rezoning proposals.
- The assigned school. Nearby schools are schools near the address, not the schools a home is assigned to.
Our home buyer due diligence checklist marks which checks our report covers and which ones only the official source can answer.
Should I use free tools or Ampian AI?
Ask yourself these three questions:
- How many homes are you comparing? Researching one home yourself may be manageable. Comparing several means repeating the checks and calculating costs consistently for each property.
- Do you have the seller’s bills, an insurance quote and tax guidance? These provide a more specific basis for your budget. If you’re still waiting for them, a report can give you preliminary estimates.
- Would an annual cost estimate help you compare homes? You can calculate it yourself or use True Cost Forecaster to bring estimated expenses together for each property.
Before making an offer: Whichever way you go, check the home’s official FEMA flood zone, confirm your lender’s insurance requirements, obtain an insurance quote and ask the assessor how the purchase could affect your taxes. Our reports help inform your decision, but important details should be confirmed before you commit.
How Ampian AI helps
Ampian AI’s Zoning Oracle and True Cost Forecaster gather and organize information for a specific address. Our free Zoning Oracle sample report illustrates the findings for a Redondo Beach property: its zoning classification, FEMA flood and natural-hazard ratings, nearby schools, five reported development projects2 and local home-price changes over five and ten years. The price figures describe past trends, not future values. Our free True Cost Forecaster sample report breaks down ten expense categories for an early-1900s Dorchester home, including mortgage payments, property taxes, insurance, utilities and savings for major repairs. The total estimated annual budget ranges from $127,8391 to $150,968 a year1. These figures illustrate one sample property, not typical homeownership costs.
Our About Our Data page explains the sources and limitations behind both reports. You can purchase reports individually or choose a monthly plan while comparing homes. See Pricing for current options.
Frequently asked questions
Isn’t the data in an Ampian AI report free?
Much of the information is publicly available through FEMA, the Forest Service and local tax offices. Ampian AI saves you the work of finding and interpreting the sources covered by its reports. We use AI to turn complex information into clear explanations: True Cost Forecaster brings estimated expenses into an annual budget, while Zoning Oracle explains zoning, hazards and neighborhood details. You don’t need specialized real estate knowledge to get started. Our source information and stated limitations also help you understand what the findings mean and which details need further confirmation.
Is FEMA’s flood map enough to check a house for flooding?
FEMA’s map identifies the official flood zone, but it does not capture every flood risk. Homes in high-risk zones with government-backed mortgages generally require flood insurance, and some lenders require coverage elsewhere. According to FEMA FloodSmart, 29%4 of NFIP claims from 2014–2024 came from outside areas currently classified as high risk. Most homeowners policies exclude flood damage, so request a flood insurance quote regardless of the zone.
Does an Ampian AI report replace a home inspection or an insurance quote?
No. Our reports do not assess the home’s physical condition or replace an inspection. Your local tax office determines your taxes, and an insurer provides your insurance quote. Our estimated cost ranges help you compare homes while you gather those details.
How do I check a house myself before making an offer?
Start with FEMA’s Flood Map Service Center to find the home’s flood zone, then review the area’s natural hazards and wildfire risk. Check local property tax records and ask the assessor how buying the home could affect your bill. Request an insurance quote, obtain the seller’s past 12 months of utility bills, and confirm zoning rules with the local planning office. Finally, build a monthly budget that includes mortgage payments, taxes, insurance, utilities, applicable fees and repair savings, counting each expense only once.
Sources
- Ampian AI, True Cost Forecaster sample report
- Ampian AI, Zoning Oracle sample report
- FEMA, Flood Map Service Center
- FEMA FloodSmart, What is my flood risk?
- FEMA, Resilience Analysis and Planning Tool (home of the National Risk Index)
- USDA Forest Service, Wildfire Risk to Communities
- TechCrunch, Zillow drops climate risk scores after agents complained of lost sales, December 1, 2025
- Insurance Journal (Bloomberg), Zillow Deleting Home Climate Risk Scores Reveals Limits of Flood, Fire Data, December 10, 2025
- City of Boston, Assessing Department
- California State Board of Equalization, Change in Ownership FAQ
- Consumer Financial Protection Bureau, What is an escrow or impound account?
- Zillow, Mortgage calculator
- San Francisco Planning, Find My Zoning
- Ampian AI, About Our Data
- Ampian AI, Pricing
- Our own math: the True Cost Forecaster sample's typical annual cost minus its principal and interest (source 1)
- First Street
- FEMA NFIP, Questions and Answers for Real Estate Professionals, August 2025