Flood and Wildfire Risk Now That Zillow Dropped Its Climate Scores: Where Buyers Can Still Check for Free
Zillow stopped showing First Street's climate risk scores on its listings in November 2025. Here is what changed, where buyers can find free flood and wildfire maps, and what those maps can tell you about a home.

Written by Toan Vo ·
This article was drafted with AI help, reviewed, and approved by Toan Vo.
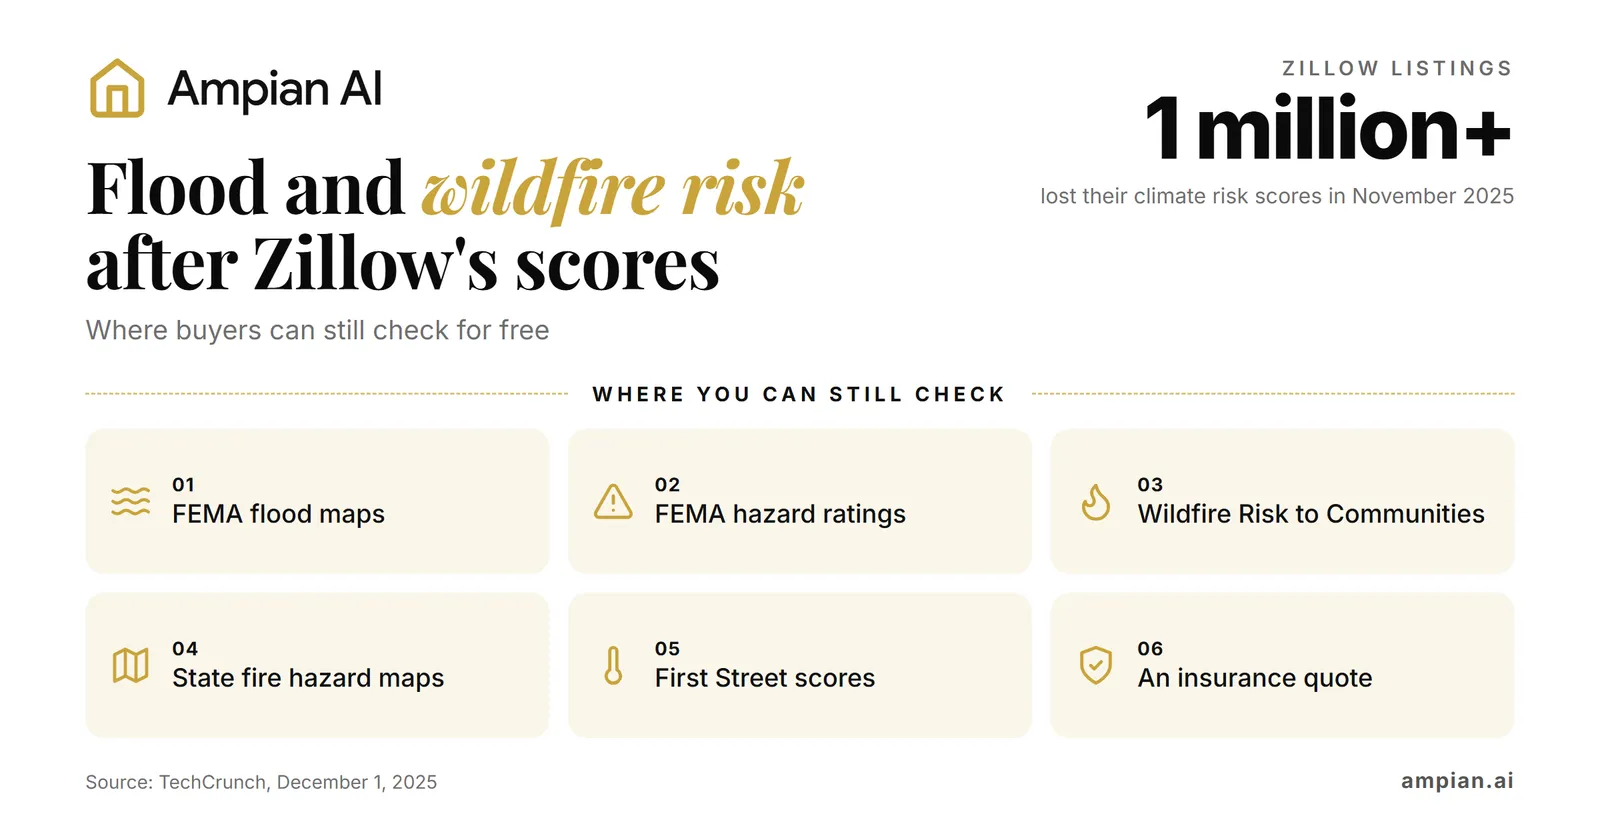
Zillow took First Street’s climate risk scores off more than 1 million listings in November 20251. Buyers can still use free FEMA flood maps and U.S. Forest Service wildfire maps1317. Zillow’s listings still link to property scores on First Street’s website5.
This guide explains where to check, what each source measures, and which questions to ask before making an offer. It also shows how Ampian AI brings hazard information together in an address report19. Sources were reviewed on October 19, 2026; listing features can change.
Key takeaways
- Zillow’s removal took effect on November 14, 20253. Its listings now link to First Street’s website instead of showing the scores on the page1.
- A Clever Real Estate buyer’s guide updated in August 2026 says FEMA flood-zone information remains on Zillow listings, and climate risk layers remain in its map view7.
- Redfin’s New York housing market page still displayed First Street ratings when reviewed on October 19, 20269. In December 2025, Redfin said sellers could request removal of information they believed was inaccurate4.
- FEMA’s Flood Map Service Center is still the official source for flood zones13. A home outside a high-risk zone can still flood: 29% of federal flood insurance claims from 2014 to 2024 came from outside high-risk flood areas14.
- FEMA’s National Risk Index rates 18 natural hazards by census tract or county, not by house15. Its old website is gone, and the data now lives in FEMA’s mapping tool, RAPT15.
- The Forest Service’s Wildfire Risk to Communities site is free, but it is built for communities and “not designed for considering risk at the individual home scale”17.
- Risk models can produce different estimates. In one comparison, two flood models matched just 21% of the time3. Therefore, use the free tools to guide further checks, then confirm insurance availability and cost for the address.
What Zillow changed, and why
Zillow first added First Street’s climate risk data to its listings in September 20241. The scores covered flooding, wildfires, high winds, extreme heat and air quality4. Just over a year later, Zillow took them off its listing pages. The change took effect on November 14, 20253.
The push came from the California Regional Multiple Listing Service (CRMLS), one of the largest listing databases in the country4. Its chief executive questioned the accuracy of First Street’s flood numbers and said that showing “the probability of a specific home flooding this year, or in the next five years, can have a significant impact on the perceived desirability to purchase that property.”4 Agents had also complained that the scores were costing them sales1. Zillow’s own analysis found that just 52%4 of high flood risk homes listed in June 2024 had sold by March 2025, compared with 71% of low-risk homes4.
Zillow said the change addressed different listing-service requirements and applied across its site, including outside California2. And although the listing service’s concern was mainly flooding, Zillow removed all of the climate data, including fire, air quality, heat and wind5.
First Street defended its models. Its spokesperson told TechCrunch: “The risk doesn’t go away; it just moves from a pre-purchase decision into a post-purchase liability.”1 That distinction matters when deciding what to investigate next.
Before you offer: A missing climate score is not evidence that a home is safe. Check the available hazard information before deciding.
What the listing sites show today
Zillow. According to a Clever Real Estate buyer’s guide updated in August 2026, Zillow’s December 2025 update replaced the numerical scores with a link to First Street, and FEMA flood-zone information and optional climate risk layers in the search map remain on Zillow7.
Redfin. Redfin’s climate information comes from First Street’s tools and covers flooding, wildfires, hurricane winds, air pollution and extreme heat, both today and 30 years out8. In December 2025 Redfin said it would keep providing estimates of “the risks of fires, floods, and storms”4. Its New York housing market page displayed flood, fire, wind and heat ratings in our October 19, 2026 review9. Redfin’s December 2025 statement also allowed sellers to request removal of information they believed was inaccurate4.
Realtor.com. First Street’s scores first appeared on Realtor.com in 20201. In December 2025 the CRMLS asked Realtor.com, Redfin and Homes.com to remove First Street’s predictive numbers and flood maps too4, and Realtor.com said it planned to keep showing climate risk data5. As of December 3, 2025, First Street data was still on Realtor.com listings6, and it was still there when we checked a Realtor.com listing on October 19, 2026.
Before you offer: Check the information available for the exact address. A city rating or a nearby home’s score may not describe the property you want to buy.
Where to check flood risk for free
FEMA’s Flood Map Service Center
FEMA’s Flood Map Service Center provides the official flood maps used by the National Flood Insurance Program (NFIP). Enter an address to find the available map and its flood-zone designation13.
Our guide on how to check if a house is in a flood zone explains the lookup process and the zone labels.
Its honest limits: FEMA’s maps change. FEMA itself says information you download “may change or become superseded by new maps over time.”13 A lower-risk zone also does not rule out flooding. FEMA reports that 29% of NFIP claims from 2014 to 2024 came from outside current high-risk flood areas14. Learn more about why “not in a flood zone” doesn’t mean no flood risk.
FEMA’s National Risk Index
The National Risk Index covers 18 natural hazards and offers “a baseline risk measurement for expected annual loss, social vulnerability and community resilience at the Census tract or county level.”15
One change buyers should know about: “the National Risk Index application is no longer available.”15 The old website now forwards to FEMA’s Resilience Analysis and Planning Tool (RAPT), where the latest version of the data, v1.20, is now available16.
Its honest limits: An area rating cannot tell you how one house differs from another15. A home beside a creek and one uphill may share a census-tract rating. RAPT also requires users to select map layers for some comparisons. Check the data date rather than assuming the index is updated regularly16.
Before you offer: Look up the address on FEMA’s Flood Map Service Center, then ask an insurance agent for a flood insurance quote, even if the home is outside a high-risk zone.
Where to check wildfire risk for free
The Forest Service’s Wildfire Risk to Communities
Wildfire Risk to Communities is a free U.S. Forest Service resource with maps and information for communities, counties and states17. Use it to understand wildfire conditions in the surrounding area.
Its honest limits: It does not assess an individual home’s construction or fire-protection improvements. It also does not show current fire danger or project future climate conditions. The Forest Service recommends individual home assessments to understand a building’s vulnerability and says its national maps should not replace local assessments17.
Your state’s wildfire hazard map
Some states publish their own maps. In California, CAL FIRE’s Fire Hazard Severity Zones classify mapped areas as Moderate, High or Very High fire hazard20, and you can search an address in CAL FIRE’s Fire Hazard Severity Zone Viewer20.
Its honest limits: The zone map “evaluates ‘hazard,’ not ‘risk’.”18 Hazard is based on the physical conditions of the land “over a 30 to 50-year period without considering mitigation measures such as home hardening, recent wildfire, or fuel reduction efforts.”18 In other words, it tells you about the area, not about how well a particular house is protected.
Selling a home in a high-hazard zone can come with extra rules. In Arcadia, California, for example, the owner of a home in the city’s Very High Fire Hazard Severity Zone must give the buyer proof of a defensible space inspection18.
Before you offer: Look up the community on Wildfire Risk to Communities and the address on your state’s hazard map, if there is one. Then ask your insurance agent whether the home can be insured for fire, and at what price, before you commit.
First Street: the scores Zillow used to show
First Street is the company behind the scores Zillow removed, and Zillow’s listings now send you to its website1. Its former consumer address, riskfactor.com, redirects to First Street, where visitors encounter MSCI terms of use and a privacy notice10. MSCI completed its acquisition of First Street on August 3, 202611.
First Street still gives a free risk score for one address on its own site, after you accept MSCI’s terms of use (checked in October 2026). If you live in Connecticut, the state insurance department offers a free tool built with First Street: “Users can enter any Connecticut address to view maps for flood, fire, wind, air quality, and extreme heat.”12
Its honest limits: First Street’s scores estimate a building’s exposure to a hazard over 30 years, “not potential damage”3. A house surrounded by floodwater that sits higher than the water can take no damage at all3. And because First Street is a private company, independent scientists say its accuracy is hard to check from the outside4.
Why the risk scores disagree
Different models use different data and assumptions. A U.K. industry group asked 13 climate risk companies to rate the same 100 properties, and “the ratings were all over the place.”3 Disagreement does not, by itself, show which estimate is correct.
The tools also answer different questions. FEMA’s flood map identifies official flood zones13. The Forest Service’s tool compares community wildfire risk17. First Street’s property scores describe modeled conditions over decades8. None of these is a quote for insuring the house.
Before you offer: If the results differ, check that they cover the same address, hazard and time period. Ask about past damage and protective improvements, and confirm insurance terms separately.
How Ampian AI checks this
Our Ampian AI Zoning Oracle report has an Environmental Risk section that puts FEMA and Forest Service hazard data in one place for a single address. For the Redondo Beach home in our free Zoning Oracle sample, it shows Flood as Minimal and Earthquake as Relatively High, with tornado, strong wind, heat wave and hail rated Very Low19. The sample’s flood line comes from FEMA’s flood map for that parcel, and its earthquake rating comes from FEMA’s National Risk Index for the tract19. The sample doesn’t show a wildfire rating for that home.
We are open about the same limits described above. The Ampian AI Zoning Oracle sample lists its climate data sources as FEMA’s National Flood Hazard Layer (parcel-level), the Forest Service’s Wildfire Hazard Potential 2023 (area-scale, not parcel-specific) and the FEMA National Risk Index v1.20 (a tract-level rating), and it calls them “screening estimates that describe the surrounding area” and asks readers to “verify locally before relying on them”19. An Ampian AI report doesn’t replace a flood or fire insurance quote, and it doesn’t replace a home wildfire assessment.
Explore the Zoning Oracle sample’s Environmental Risk section to see how it reads, or visit our pricing page for current report options.
Frequently asked questions
Why did Zillow remove climate risk scores from its listings?
Zillow took First Street’s climate risk scores off its listing pages in November 2025 after the California Regional Multiple Listing Service objected to the flood numbers and agents complained the scores were costing them sales. Zillow said it made the change to meet varying listing service requirements and applied it to every listing in the country.
Does Zillow still show any climate risk information?
Zillow listings still link to First Street’s website instead of showing the scores on the page. Recent reports say Zillow’s map still offers FEMA flood zone and climate risk layers, but check a listing yourself, because Zillow can change its pages at any time.
Where can I check a home’s wildfire risk for free?
Start with the U.S. Forest Service’s Wildfire Risk to Communities site, which rates wildfire risk for communities, counties and states. Then check your state’s own wildfire hazard map if it has one, such as CAL FIRE’s Fire Hazard Severity Zones in California. Neither one rates a single house, so ask an insurance agent about the home itself.
Does Redfin still show flood and wildfire risk scores?
In December 2025 Redfin said it would keep showing First Street’s flood, fire and storm estimates, and its city pages still showed First Street ratings in October 2026. Sellers can ask Redfin to remove the information from their listing, so a missing score does not mean a home has no risk.
Why do flood risk scores disagree with FEMA flood maps?
FEMA’s maps show the official flood zones used for the federal flood insurance program, while private scores like First Street’s use their own models of rain, rivers and tides over 30 years. Different models often give the same house different answers. Treat any score as a reason to ask more questions, not as the final word.
Sources
- TechCrunch, Zillow drops climate risk scores after agents complained of lost sales, December 1, 2025
- GeekWire, Zillow removes climate data from home listings, but it's unclear why, December 1, 2025
- Insurance Journal (Bloomberg), Zillow climate scores and how risk models disagree, December 10, 2025
- CNN, The real estate industry is pressuring Zillow and other sites to nix extreme weather risk data, December 2, 2025
- SFGATE, California real estate group pressures Zillow to hide climate data, December 8, 2025
- HousingWire, Redfin defends climate risk transparency after Zillow removes data, December 3, 2025
- Clever Real Estate, Best Real Estate Websites for Buyers, updated August 25, 2026
- Redfin, Climate risk methodology
- Redfin, New York housing market page (climate risk panel), checked October 2026
- First Street website (riskfactor.com now opens here), opened October 15, 2026
- MSCI, MSCI completes acquisition of First Street, August 3, 2026
- Connecticut Insurance Department, Free Climate Risk Mapping Tool
- FEMA Flood Map Service Center
- FEMA FloodSmart, What is my flood risk?
- FEMA, National Risk Index
- FEMA, Resilience Analysis and Planning Tool (RAPT)
- USDA Forest Service, Wildfire Risk to Communities, Frequently Asked Questions
- City of Arcadia, California, Fire Hazard Severity Zone
- Ampian AI, Zoning Oracle sample report
- City of Tustin, California, Fire Hazard Severity Zone