Do Recent Home Buyers Pay a Higher Property Tax Rate? A 50-State Study
Using Census data for every state and Washington, DC, we compared the property-tax rates of recent home buyers with those of owners who moved in 20 or more years ago. Recent buyers pay a clearly higher rate in 14 states and DC, a clearly lower rate in 26 states, and show no clear difference in 10.

Written by Toan Vo ·
This article was drafted with AI help, reviewed, and approved by Toan Vo.
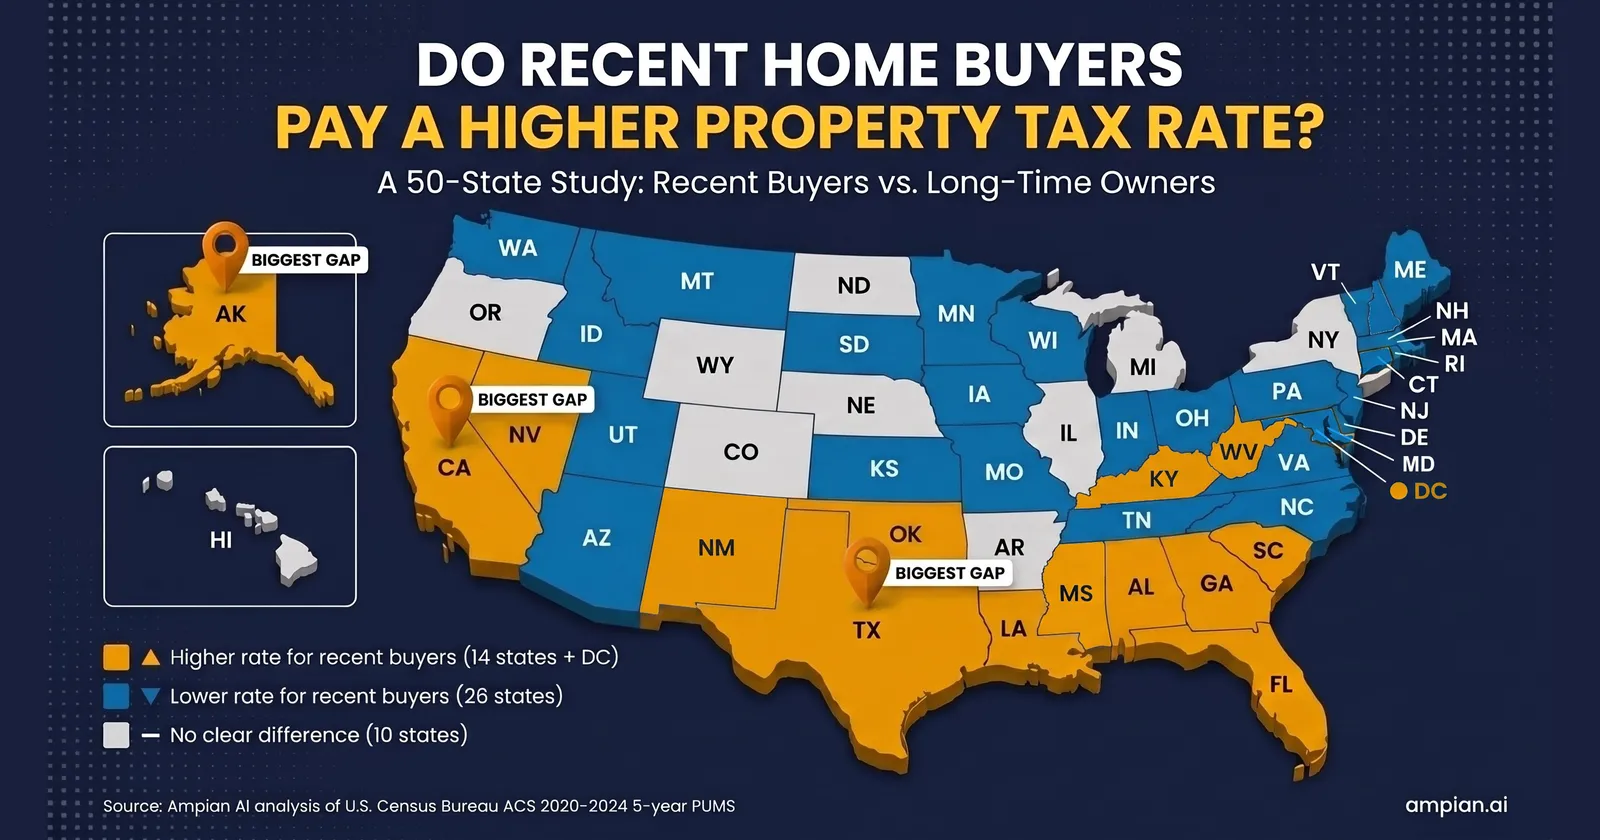
Whether recent home buyers face a higher property-tax rate than long-time owners depends on where they buy. In U.S. Census data from 2020 to 2024, recent buyers paid a clearly higher rate than long-time owners in 15 of 51 places, a clearly lower rate in 26, and showed no clear difference in 101.
We examined all 50 states and Washington, DC, comparing the annual property tax homeowners pay as a share of their home’s value. We looked at two groups of homeowners at one point in time: recent buyers who moved in less than 2 years earlier, and long-time owners who have lived in their home for 20 years or more. Our goal was to answer a straightforward question for homebuyers: in which states do recent buyers pay a higher tax rate than long-time owners, and where do they pay less?
Key takeaways
- Recent buyers pay a clearly higher property-tax rate than long-time owners in 15 places, a clearly lower rate in 26, and show no clear difference in 101.
- The largest gaps are in Alaska, Texas and California. In Texas, recent buyers pay 1.58%1 of their home’s value per year, compared with 1.25%1 for long-time owners. That is about $9201 more a year on a $280,0001 home. In California, the difference is about $1,9301 more a year on a typical $729,0001 home.
- Nationwide, recent buyers pay a slightly lower rate overall: 0.89%1 compared with 0.91%1 for long-time owners, or about $601 less a year on a typical $322,0001 home.
- This study compares different homes at one point in time. Because it does not track one house through a sale, it does not show that buying a home causes a higher bill.
- For 7 of the 15 higher-rate places, we found official tax pages stating that a sale ends the seller’s cap on yearly increases in taxable value or updates the home’s taxable value. However, not every place with such a rule shows a rate gap in the data.
- Before making an offer, ask the local tax assessor how the home’s value and property tax will be calculated after you buy. Do not base your budget on the seller’s current tax bill.
The 50-state property-tax rate comparisons
Because the Census survey collects data from a sample of households rather than every home, each estimate includes a margin of error—the range where the true figure most likely falls. We classify a place as higher or lower only when the margin of error for its gap does not reach zero. Otherwise, we list it as showing “no clear difference.”
Each row in the table below shows the middle (median) property-tax rate for recent buyers and for long-time owners, the gap between the two rates with its margin of error, and what that difference means in annual dollars on a typical home in that place.
Swipe the table sideways to see every column.
| Rank | Place | Result | Recent buyers' rate | Long-time owners' rate | Gap (points) | Dollars a year | Typical home |
|---|---|---|---|---|---|---|---|
| 1 | Alaska | Higher for recent buyers | 1.01% | 0.68% | +0.34, 90% range +0.24 to +0.44 | +$1,181, 90% range +$836 to +$1,526 | $350,000 |
| 2 | Texas | Higher for recent buyers | 1.58% | 1.25% | +0.33, 90% range +0.31 to +0.35 | +$921, 90% range +$874 to +$968 | $280,000 |
| 3 | California | Higher for recent buyers | 0.83% | 0.57% | +0.27, 90% range +0.26 to +0.27 | +$1,933, 90% range +$1,865 to +$2,001 | $729,000 |
| 4 | Louisiana | Higher for recent buyers | 0.46% | 0.26% | +0.20, 90% range +0.18 to +0.23 | +$430, 90% range +$378 to +$481 | $213,000 |
| 5 | Florida | Higher for recent buyers | 0.79% | 0.63% | +0.16, 90% range +0.15 to +0.17 | +$566, 90% range +$522 to +$610 | $350,000 |
| 6 | Mississippi | Higher for recent buyers | 0.55% | 0.42% | +0.14, 90% range +0.11 to +0.16 | +$229, 90% range +$191 to +$267 | $168,000 |
| 7 | Washington, DC | Higher for recent buyers | 0.61% | 0.52% | +0.09, 90% range +0.04 to +0.13 | +$671, 90% range +$332 to +$1,010 | $750,000 |
| 8 | Oklahoma | Higher for recent buyers | 0.82% | 0.74% | +0.08, 90% range +0.05 to +0.11 | +$158, 90% range +$108 to +$209 | $198,000 |
| 9 | Kentucky | Higher for recent buyers | 0.76% | 0.69% | +0.07, 90% range +0.05 to +0.09 | +$146, 90% range +$107 to +$185 | $203,000 |
| 10 | Georgia | Higher for recent buyers | 0.82% | 0.75% | +0.07, 90% range +0.06 to +0.08 | +$211, 90% range +$180 to +$242 | $300,000 |
| 11 | Alabama | Higher for recent buyers | 0.33% | 0.28% | +0.05, 90% range +0.04 to +0.07 | +$110, 90% range +$86 to +$134 | $206,000 |
| 12 | South Carolina | Higher for recent buyers | 0.49% | 0.44% | +0.05, 90% range +0.03 to +0.07 | +$126, 90% range +$77 to +$176 | $257,000 |
| 13 | New Mexico | Higher for recent buyers | 0.63% | 0.59% | +0.04, 90% range +0.01 to +0.06 | +$86, 90% range +$29 to +$144 | $247,000 |
| 14 | Nevada | Higher for recent buyers | 0.47% | 0.45% | +0.02, 90% range +0.01 to +0.03 | +$101, 90% range +$54 to +$149 | $429,000 |
| 15 | West Virginia | Higher for recent buyers | 0.52% | 0.50% | +0.02, 90% range +0.01 to +0.03 | +$34, 90% range +$11 to +$56 | $161,000 |
| 16 | Arkansas | No clear difference | 0.53% | 0.51% | +0.02, 90% range −0.01 to +0.04 | +$33, 90% range −$16 to +$82 | $185,000 |
| 17 | North Dakota | No clear difference | 1.00% | 0.98% | +0.02, 90% range −0.08 to +0.11 | +$45, 90% range −$191 to +$280 | $250,000 |
| 18 | Colorado | No clear difference | 0.46% | 0.46% | 0.00, 90% range −0.00 to +0.01 | +$18, 90% range −$22 to +$58 | $521,000 |
| 19 | Illinois | No clear difference | 1.97% | 1.97% | 0.00, 90% range −0.02 to +0.02 | +$2, 90% range −$48 to +$52 | $260,000 |
| 20 | Michigan | No clear difference | 1.22% | 1.22% | 0.00, 90% range −0.01 to +0.01 | $0, 90% range −$28 to +$28 | $230,000 |
| 21 | Hawaii | No clear difference | 0.26% | 0.26% | 0.00, 90% range −0.01 to +0.01 | −$14, 90% range −$108 to +$80 | $834,000 |
| 22 | New York | No clear difference | 1.64% | 1.64% | 0.00, 90% range −0.03 to +0.03 | −$11, 90% range −$128 to +$106 | $412,000 |
| 23 | Virginia | Lower for recent buyers | 0.76% | 0.77% | −0.01, 90% range −0.02 to −0.00 | −$44, 90% range −$86 to −$1 | $377,000 |
| 24 | Oregon | No clear difference | 0.81% | 0.82% | −0.01, 90% range −0.03 to +0.01 | −$59, 90% range −$162 to +$44 | $482,000 |
| 25 | Arizona | Lower for recent buyers | 0.44% | 0.46% | −0.01, 90% range −0.02 to −0.01 | −$57, 90% range −$86 to −$28 | $391,000 |
| 26 | Idaho | Lower for recent buyers | 0.49% | 0.51% | −0.02, 90% range −0.04 to −0.01 | −$91, 90% range −$156 to −$27 | $412,000 |
| 27 | Wyoming | No clear difference | 0.56% | 0.58% | −0.02, 90% range −0.05 to +0.00 | −$69, 90% range −$142 to +$5 | $300,000 |
| 28 | Indiana | Lower for recent buyers | 0.73% | 0.75% | −0.02, 90% range −0.03 to −0.02 | −$53, 90% range −$72 to −$35 | $213,000 |
| 29 | Nebraska | No clear difference | 1.47% | 1.50% | −0.03, 90% range −0.07 to +0.01 | −$63, 90% range −$157 to +$31 | $232,000 |
| 30 | Utah | Lower for recent buyers | 0.48% | 0.51% | −0.03, 90% range −0.04 to −0.02 | −$147, 90% range −$187 to −$107 | $486,000 |
| 31 | Delaware | Lower for recent buyers | 0.50% | 0.54% | −0.04, 90% range −0.06 to −0.01 | −$130, 90% range −$225 to −$36 | $348,000 |
| 32 | Iowa | Lower for recent buyers | 1.41% | 1.45% | −0.04, 90% range −0.07 to −0.01 | −$78, 90% range −$133 to −$23 | $203,000 |
| 33 | Washington | Lower for recent buyers | 0.77% | 0.81% | −0.04, 90% range −0.05 to −0.03 | −$233, 90% range −$279 to −$186 | $547,000 |
| 34 | Wisconsin | Lower for recent buyers | 1.39% | 1.43% | −0.05, 90% range −0.07 to −0.02 | −$124, 90% range −$196 to −$51 | $263,000 |
| 35 | Pennsylvania | Lower for recent buyers | 1.27% | 1.32% | −0.05, 90% range −0.07 to −0.03 | −$120, 90% range −$167 to −$72 | $250,000 |
| 36 | Minnesota | Lower for recent buyers | 1.00% | 1.05% | −0.05, 90% range −0.07 to −0.03 | −$160, 90% range −$223 to −$97 | $320,000 |
| 37 | Maryland | Lower for recent buyers | 0.94% | 0.99% | −0.05, 90% range −0.07 to −0.03 | −$212, 90% range −$292 to −$133 | $412,000 |
| 38 | Montana | Lower for recent buyers | 0.64% | 0.69% | −0.05, 90% range −0.08 to −0.02 | −$188, 90% range −$286 to −$90 | $364,000 |
| 39 | Tennessee | Lower for recent buyers | 0.47% | 0.53% | −0.06, 90% range −0.06 to −0.05 | −$156, 90% range −$179 to −$133 | $284,000 |
| 40 | Ohio | Lower for recent buyers | 1.30% | 1.36% | −0.06, 90% range −0.07 to −0.04 | −$116, 90% range −$154 to −$78 | $209,000 |
| 41 | Rhode Island | Lower for recent buyers | 1.18% | 1.24% | −0.06, 90% range −0.10 to −0.02 | −$230, 90% range −$380 to −$80 | $400,000 |
| 42 | North Carolina | Lower for recent buyers | 0.65% | 0.71% | −0.06, 90% range −0.07 to −0.05 | −$169, 90% range −$201 to −$136 | $289,000 |
| 43 | Kansas | Lower for recent buyers | 1.28% | 1.35% | −0.07, 90% range −0.10 to −0.04 | −$153, 90% range −$221 to −$86 | $214,000 |
| 44 | Maine | Lower for recent buyers | 0.97% | 1.05% | −0.08, 90% range −0.11 to −0.04 | −$218, 90% range −$330 to −$105 | $290,000 |
| 45 | New Hampshire | Lower for recent buyers | 1.62% | 1.70% | −0.08, 90% range −0.11 to −0.05 | −$320, 90% range −$425 to −$215 | $400,000 |
| 46 | Missouri | Lower for recent buyers | 0.84% | 0.92% | −0.08, 90% range −0.10 to −0.06 | −$183, 90% range −$226 to −$140 | $225,000 |
| 47 | New Jersey | Lower for recent buyers | 2.05% | 2.14% | −0.09, 90% range −0.13 to −0.06 | −$426, 90% range −$573 to −$279 | $450,000 |
| 48 | Massachusetts | Lower for recent buyers | 1.05% | 1.14% | −0.10, 90% range −0.12 to −0.07 | −$524, 90% range −$642 to −$406 | $547,000 |
| 49 | South Dakota | Lower for recent buyers | 1.02% | 1.13% | −0.11, 90% range −0.15 to −0.06 | −$273, 90% range −$394 to −$152 | $255,000 |
| 50 | Connecticut | Lower for recent buyers | 1.73% | 1.86% | −0.12, 90% range −0.16 to −0.09 | −$446, 90% range −$559 to −$332 | $360,000 |
| 51 | Vermont | Lower for recent buyers | 1.53% | 1.68% | −0.15, 90% range −0.22 to −0.08 | −$456, 90% range −$683 to −$230 | $304,000 |
| All 50 states and DC | Lower for recent buyers | 0.89% | 0.91% | −0.02, 90% range −0.03 to −0.01 | −$64, 90% range −$82 to −$47 | $322,000 |
Source: Ampian AI analysis of U.S. Census Bureau survey data from 2020–2024 (ACS 5-year PUMS).
Rate: Annual property tax divided by home value. Each figure represents the median rate for its group. Recent buyers moved into their homes less than 2 years ago; long-time owners have lived in their homes for 20 or more years.
Small second line: The 90% confidence interval for the estimated difference between the two groups. “Higher” or “Lower” means the entire range is above or below zero, respectively. If the range crosses zero, the result is “No clear difference.”
Rounding: Results are classified using exact, unrounded values. A displayed −0.00 is slightly below zero, while +0.00 is slightly above zero. As a result, two locations with the same rounded gap may fall into different categories.
Dollars per year: The estimated annual difference in property taxes, applied to a typical owner-occupied home in that location (the median home value, in 2024 dollars). A positive (+) value means recent buyers pay more per year; a negative (−) value means they pay less.
Where a sale matters most
In the places below, recent buyers pay a clearly higher property-tax rate than long-time owners. Each entry lists the two rates, followed by the annual dollar gap on a typical home in that place and its margin of error.
- Alaska. Recent buyers pay 1.01%1 of their home’s value a year, while long-time owners pay 0.68%1. That is about $1,1801 more per year on a typical $350,0001 home, give or take $3451.
- Texas. Recent buyers pay 1.58%1, while long-time owners pay 1.25%1. That is about $9201 more per year on a typical $280,0001 home, give or take $471.
- California. Recent buyers pay 0.83%1, while long-time owners pay 0.57%1. That is about $1,9301 more per year on a typical $729,0001 home, give or take $681.
- Louisiana. Recent buyers pay 0.46%1, while long-time owners pay 0.26%1. That is about $4301 more per year on a typical $213,0001 home, give or take $521.
- Florida. Recent buyers pay 0.79%1, while long-time owners pay 0.63%1. That is about $5701 more per year on a typical $350,0001 home, give or take $441.
- Mississippi. Recent buyers pay 0.55%1, while long-time owners pay 0.42%1. That is about $2301 more per year on a typical $168,0001 home, give or take $381.
- Washington, DC. Recent buyers pay 0.61%1, while long-time owners pay 0.52%1. That is about $6701 more per year on a typical $750,0001 home, give or take $3391.
The margins of error are widest in Alaska and Washington, DC, which have the fewest survey records among the higher-rate places1. The other eight places where recent buyers pay a higher rate are Oklahoma, Kentucky, Georgia, Alabama, South Carolina, New Mexico, Nevada and West Virginia. Their gaps are smaller, ranging from about $301 per year in West Virginia to about $2101 in Georgia on each place’s typical home.
What the official rules say
For 7 of the 15 higher-rate places, we found official tax agency pages stating that a sale ends the seller’s limit on annual assessment increases or resets the home’s taxable value to current market levels:
- California. When a home changes ownership, “Proposition 13 requires the county assessor to reassess the property to its current fair market value”7.
- Florida. After an ownership change, a Save Our Homes property “will lose the SOH benefit and will be subject to assessment at just value on the following January 1”8.
- Texas. The homestead cap “expires on Jan. 1 of the tax year following the year in which the property owner no longer qualifies for the residence homestead exemption”9.
- Oklahoma. The annual limit “is valid on the property as long as title to the property is not transferred, changed, or conveyed”10.
- New Mexico. Bernalillo County’s assessor informs buyers that their property’s “value will be brought to current and correct market value next tax year”11.
- South Carolina. “After an assessable transfer of interest occurs, the fair market value of the parcel will be adjusted by appraisal”12.
- Washington, DC. “New property owners may receive the sellers cap credit only in the half the property was purchased”13.
However, state rules do not always match the survey gaps. Michigan and Maryland also remove the seller’s assessment limit when a home is sold1415, yet Michigan shows no clear difference and recent buyers in Maryland pay a lower rate. In Michigan, the cap ends “in the calendar year following the year of the transfer of ownership”14, meaning a recent buyer’s tax bill may not yet reflect the updated taxable value. For the remaining higher-rate states, including Alaska, Louisiana and Mississippi, this study does not test why the rate gap exists.
Where recent buyers pay less
In 26 places, recent buyers pay a clearly lower property-tax rate than long-time owners. Below are the places with the largest rate differences:
- Vermont. Recent buyers pay 1.53%1, while long-time owners pay 1.68%1. That is about $4601 less per year on a typical $304,0001 home, give or take $2271.
- Connecticut. Recent buyers pay 1.73%1, while long-time owners pay 1.86%1. That is about $4501 less per year on a typical $360,0001 home, give or take $1131.
- South Dakota. Recent buyers pay 1.02%1, while long-time owners pay 1.13%1. That is about $2701 less per year on a typical $255,0001 home, give or take $1211.
- Massachusetts. Recent buyers pay 1.05%1, while long-time owners pay 1.14%1. That is about $5201 less per year on a typical $547,0001 home, give or take $1181.
- New Jersey. Recent buyers pay 2.05%1, while long-time owners pay 2.14%1. That is about $4301 less per year on a typical $450,0001 home, give or take $1471.
These differences are smaller than the widest gaps in states where recent buyers pay more. No lower-rate gap exceeds 0.15 percentage points, whereas the gaps in Alaska and Texas exceed 0.30 points1. This study does not test why recent buyers pay less in these states.
In 10 places, the margin of error reaches zero, meaning the data show no clear difference between recent buyers and long-time owners: Arkansas, Colorado, Hawaii, Illinois, Michigan, Nebraska, New York, North Dakota, Oregon and Wyoming1.
A lower state rate for recent buyers does not mean your own property tax bill will drop after you buy a home. Because this study compares different groups of homes at a single point in time, your actual bill depends on local tax rules and the specific property you buy.
What this means if you are buying
If you are buying a home in one of the 15 places where recent buyers pay higher rates, plan for the possibility that your property tax will be higher than the seller’s bill. Even in other states, an individual home’s tax bill can change after a sale. This study measures the middle tax rate across an entire state, not the exact tax bill for one house.
Our guide Will my property tax go up after I buy? explains how state reassessment rules work, which homeowner exemptions you must apply for yourself, and how to estimate your future bill.
Before you make an offer: Contact the county assessor to ask how the home’s taxable value will be calculated after you buy and which exemptions you qualify for. Apply the local tax rate to that updated value—do not assume you will pay the seller’s current tax bill.
To help home buyers avoid surprises, the Ampian AI True Cost Forecaster estimates your property tax based on your purchase price, rather than from the seller’s tax bill16. You can see how this works on a labeled example home in our free True Cost Forecaster sample report.
How we calculated the 50-state property-tax rates
Every figure in this study comes from the same six steps.
- The data. We used the U.S. Census Bureau’s American Community Survey 2020-2024 five-year Public Use Microdata Sample (PUMS), released March 5, 2026, covering all 50 states and Washington, DC2. The Census Bureau describes five-year estimates as the “Most reliable” and recommends them for “Analyzing very small populations”5, such as recent homebuyers in a small state. This is the latest available five-year file; a release date for the next one has not yet been announced17.
- The homes. We included owner-occupied homes with a reported annual property tax and a home value above zero. We defined recent buyers as homeowners who moved into their home less than two years before responding to the survey. Long-time owners were those who moved in 20 or more years earlier3.
- Each home’s own tax rate. For each home, we divided the annual property tax by the home’s reported value3. This gives the share of the home’s value paid in property taxes each year.
- The median rates for each group. For each state or Washington, DC, we ranked homes’ property tax rates from lowest to highest and calculated the median (the middle value) separately for recent buyers and long-time owners. We applied the survey weights so that each home represented the number of homes it stands for in the population. This approach differs from the measure used in WalletHub’s annual ranking, which divides the median property tax bill by the median home value6. We instead calculate each home’s individual tax rate before finding the median for each group. This matters because recent buyers and long-time owners often live in homes with different values.
- The gap, in points and in dollars. We calculated the gap by subtracting long-time owners’ median tax rate from recent buyers’ median tax rate. In Texas, for example, the median rate was 1.58%1 for recent buyers and 1.25%1 for long-time owners, a difference of 0.33 percentage points1. To express this difference in dollars, we applied the rate gap to the state’s typical home value: the median value of all owner-occupied homes. We used values adjusted to 2024 dollars3 with the Census Bureau’s adjustment factor and rounded to the nearest $1,0003. For Texas, the typical home value was $280,0001. Applying the 0.33-percentage-point gap to that value yields an estimated difference of about $920 per year1.
- Higher, lower or no clear difference. Because the ACS is based on a sample of homes rather than a complete count, each estimated gap has a margin of error. We calculated margins of error at the 90%4 confidence level using the file’s 80 replicate weights and the Census Bureau’s standard method4. We classified a state as “higher” or “lower” only when the entire range of the estimated gap—its value plus or minus the margin of error—was above or below zero, respectively. If the range included zero, we classified the result as “no clear difference.” For example, Indiana’s estimated gap was −0.02 percentage points, with a margin of error of 0.01 points1. Because the entire range falls below zero, we classified Indiana as “lower.” Nebraska’s estimated gap was slightly larger in magnitude, at −0.03 percentage points, but its margin of error was 0.04 points1. Its range therefore extends from −0.07 to +0.01 percentage points, including zero. We classified Nebraska as having “no clear difference.”
Limits
- Self-reported survey responses. Property tax amounts and home values are what homeowners reported to the Census Bureau, rather than official county tax records.
- Rounded and capped amounts. The Census Bureau rounds both tax and home-value figures and caps very high amounts at a top value3. As a result, middle values can land on those rounding steps.
- A recent buyer’s bill may still reflect the seller’s assessment. In some states, a home sale updates the tax bill only in the following year814. Some recent buyers—especially those who moved in 12 months ago or less—may still be reporting a bill based on the previous owner’s taxable value.
- Different homes compared at one point in time. We compare the homes owned by recent buyers with homes owned by long-time owners during the same survey period. Because we do not track one house before and after a sale, this study cannot show that a sale causes a tax change, or explain why a state’s gap exists.
- Five years of pooled survey data. The dataset combines survey responses from 2020 to 20244. The tax rates need no adjustment; dollar figures are converted to 2024 dollars using the Census Bureau’s adjustment factor3.
- Margins of error do not include every source of error. The Census Bureau notes that its standard errors “represent a lower bound of the total error”4, because they do not include every type of error, such as mistakes in collecting or processing survey answers. The true uncertainty can be somewhat wider than shown.
- No outside adjustments. Every figure comes directly from the public Census files. We added no outside data, custom estimates, or manual corrections.
Frequently asked questions
Do recent home buyers pay a higher property-tax rate than long-time owners?
In some states, but not everywhere. In Census data for 2020 to 2024, recent buyers paid a clearly higher rate in 15 of 51 places, a clearly lower rate in 26, and showed no clear difference in 10. Across the whole country, recent buyers paid a slightly lower rate.
Where is the gap in recent buyers’ property-tax rate largest?
Alaska, Texas and California show the largest gaps, followed by Louisiana and Florida. In each, recent buyers paid a clearly higher share of their home’s value in property tax than owners who moved in 20 or more years earlier. The study does not test why, so confirm the tax rules where you are buying.
Does this study show that a sale raises a home’s property tax?
No. It compares two different groups of homes at the same time: homes bought recently and homes owned for 20 years or more. It does not follow one house before and after a sale. To know what will happen to a specific home after a purchase, ask your local tax assessor.
What does no clear difference mean in the table?
It means the data cannot tell whether recent buyers there pay more or less than long-time owners. The Census survey covers a sample of homes, so each gap has a margin of error, a range the true gap most likely falls in. When that range runs from below zero to above zero, the true gap could be zero. Ten states fall in this group.
Sources
- Ampian AI analysis of U.S. Census Bureau data: American Community Survey 2020-2024 5-year Public Use Microdata Sample (PUMS), housing files
- U.S. Census Bureau, 2024 ACS data releases
- U.S. Census Bureau, 2020-2024 ACS PUMS Data Dictionary, March 5, 2026
- U.S. Census Bureau, Public Use Microdata Sample (PUMS) Accuracy of the Data (2020-2024)
- U.S. Census Bureau, When to use 1-year or 5-year estimates
- WalletHub, Property Taxes by State, February 17, 2026
- California State Board of Equalization, Change in Ownership FAQ
- Florida Department of Revenue, Save Our Homes Assessment Limitation and Portability Transfer (PT-112)
- Texas Comptroller of Public Accounts, Texas Property Tax Basics, January 2026
- Oklahoma Tax Commission, OAC 710:10 Ad Valorem rules, 2026
- Bernalillo County Assessor (New Mexico), For New Homeowners
- South Carolina Department of Revenue, Tax Information Educational Digest, Chapter 5: Individual Property Taxes, 2025
- District of Columbia Office of Tax and Revenue, Real Property Tax Reliefs, Credits, and Deductions
- Michigan Department of Treasury, Changes in Ownership and Uncapping of Property
- Maryland Department of Assessments and Taxation, Homestead Tax Credit
- Ampian AI, True Cost Forecaster sample report
- U.S. Census Bureau, 2025 ACS data release schedule